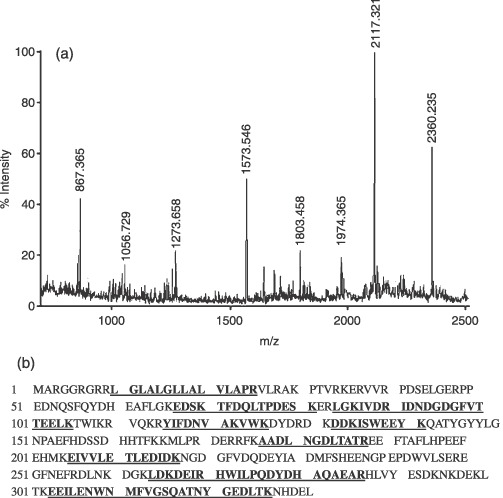
Figure 3.

PMF analysis of differentially expressed proteins with spot 2 as typical protein. (a) Peptide mass fingerprint for trypsin digest of spot 2 identified as reticulocalbin 1. The X‐axis represents mass‐to‐charge ratio (m/z), whereas the Y‐axis represents relative abundance. (b) Protein sequence of reticulocalbin 1 and matched peptide fragments indicated in bold font and underlined. Fixed modifications: carbamidomethyl; variable modifications: oxidation; cleavage by trypsin: cuts C‐term side of KR unless next residue is P; number of mass values searched: 24; number of mass values matched: 11; sequence coverage: 44%.
