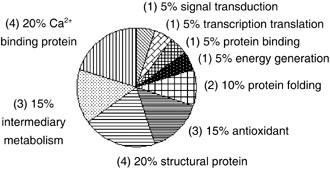
Figure 4.

Pie chart representing distribution of the 20 differentially expressed proteins in hTERT–hMSCs in comparison to primary hMSCs, according to their biological functions. Numbers in the brackets represent the number of identified proteins. hMSCs, human mesenchymal stem cells; hTERT, human telomerase reverse transcriptase.
