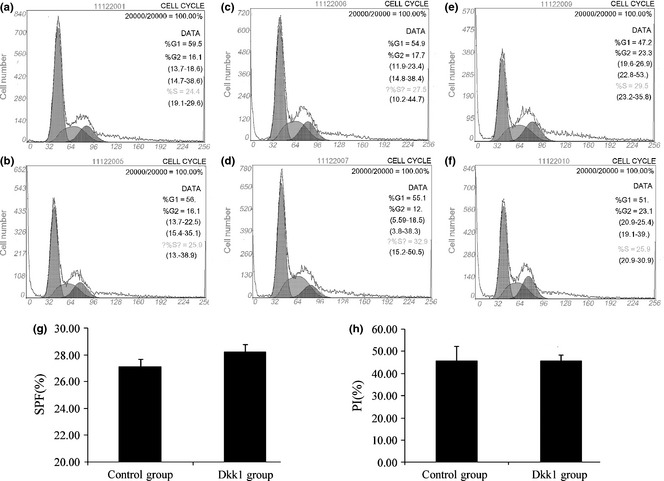
Figure 1.

Proliferation of mesenchymal stem cells ( MSC s) after addition of Dkk1. (a, c, e) Cell cycle of control group by flow cytometric assay; (b, d, f) cell cycle of Dkk1 group; a and b, c and d, e and f obtained under the same conditions. No clear differences could be seen. (g) Propidium iodide (PI) of two groups and (h) S‐phase fraction (SPF). Data represent mean ± SD (n = 3).
