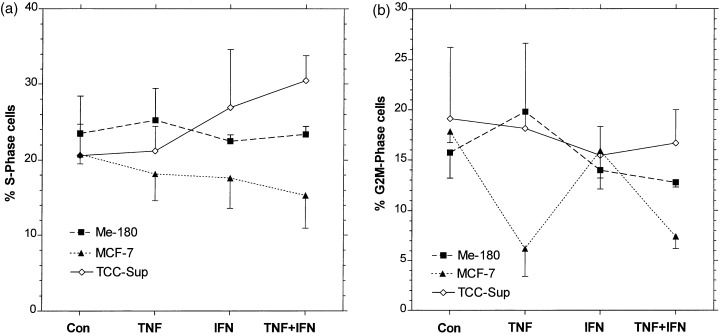
Figure 2.

Influence of TNF, IFN, and TNF + IFN, same concentrations as in Fig. 1 , on the fractions of cells in S‐phase (a) and G 2 ‐M‐phase (b). Flow cytometry measurements after PI staining, see Materials and methods . Mean values and error bars as in Fig. 1 .
