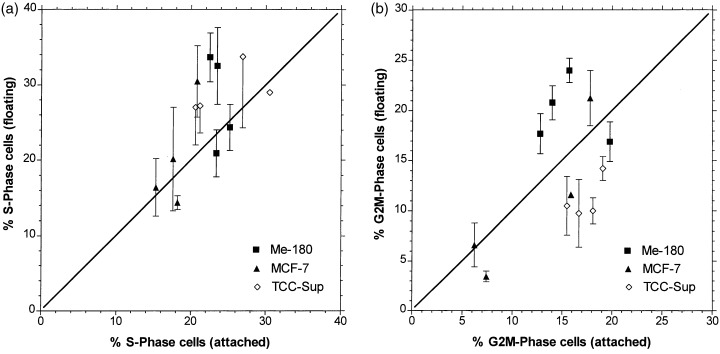
Figure 3.

Correlation of percentage S‐phase cells (a) and percentage G 2 M‐phase cells (b) in the viable population (attached to culture flask bottom) and in the apoptotic population (floating cells). Symbols on the straight line represent equal values in both populations. Mean values and error bars as in Fig. 1 .
