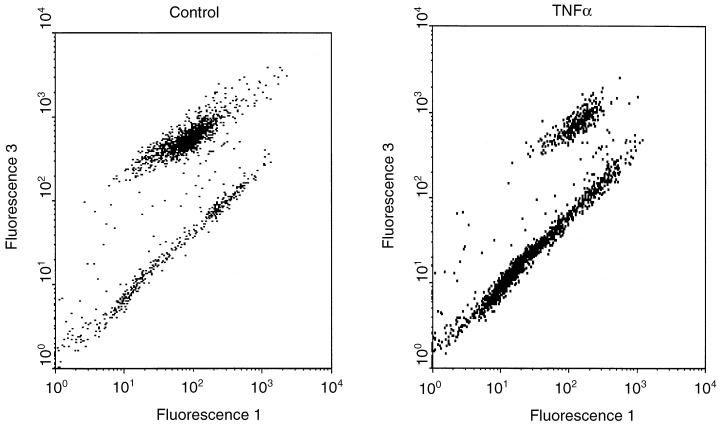
Figure 4.

Analysis of mitochondrial membrane potential as an apoptotic marker. Me‐180 cells treated for 24 h with 1000 U/ml TNF were measured after staining with Mito Tracker green and red in a FACScan. Mito Tracker green (Fluorescence 1) represents the total mass of mitochondria per cell, Mito Tracker red (Fluorescence 3) fluorescence is strongly decreased when the membrane of mitochondria is depolarized, which is one trait of apoptotic cells. In the dot plot, the lower cluster represents apoptotic cells, of which the shrunken cells in late apoptosis appear at small fluorescence 1‐values near the origin.
