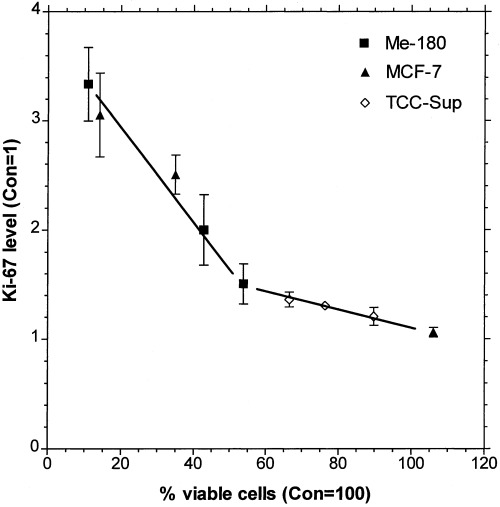
Figure 8.

Correlation of percentage viable cells (attached to the culture flask bottom, see Fig. 1 ) to the level of Ki‐67 expression ( Fig. 7 ). Ki‐67 fluorescence intensity of TNF, IFN, and TNF + IFN treated cells (2d) was normalized to the control at day 2. A level of two represents a 2‐fold Ki‐67 expression compared to the untreated control.
