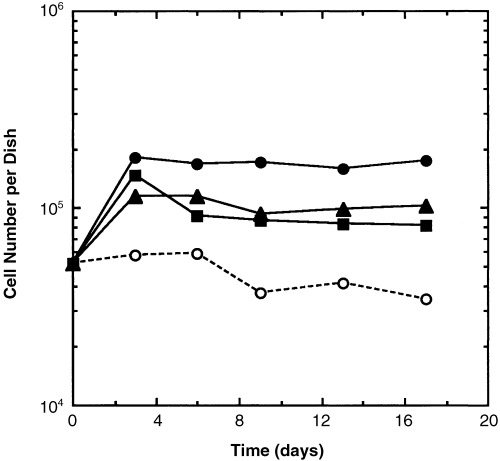
Figure 5.

MMEC proliferation stimulated by growth factors. (○) Control culture medium with insulin, transferrin, and 0.5% new‐born calf serum. (▴) Control medium plus 10 ng/ml TGFα (▪) Control medium plus 50 ng/ml bFGF. (•) Control medium plus TGFα and bFGF. The control curve without TGFα and bFGF differs significantly from the other curves at P < 0.05, as does the curve with both TGFα and bFGF. The curves representing cell numbers from cultures to which either TFGα or bFGF were added do not differ significantly from each other. The results are from one experiment which is representative of three experiments.
