
Figure 4.
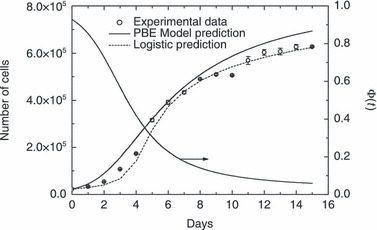
Comparison between model predictions and experimental data for cell culture in Petri dishes starting with 2.3 × 10⁴ cells. Data are expressed as mean ± standard deviation. Temporal evolution of geometric limiting factor Φ(t) defined by eqn (12) also plotted.