
Figure 8.
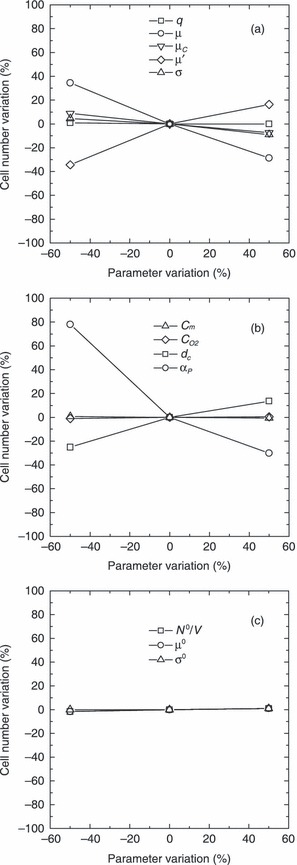
Sensitivity analysis on cell number after 15 days of culture by varying parameters q, µ, µC, µ′, and σ (a), Cm,
 , dc, and αP (b), and N
0/V, µ0, and σ0 (c). Base case is related to model parameters reported in Table 2 when N
0 = 3.6 × 10⁴.
, dc, and αP (b), and N
0/V, µ0, and σ0 (c). Base case is related to model parameters reported in Table 2 when N
0 = 3.6 × 10⁴.