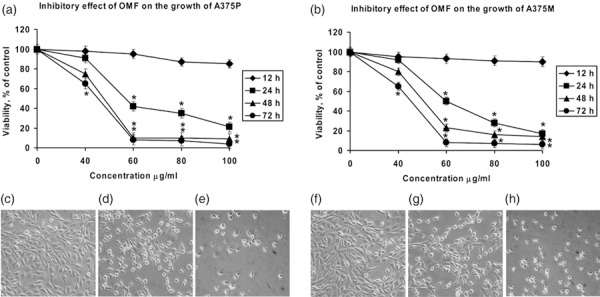
Figure 1.

Effect of 3‐O‐methylfunicone (OMF) treatment on cell proliferation (a and b, MTT assay) and on cell morphology of A375P (c–e) and A375M cells (f–h) defined by phase‐contrast microscopy. (a and b) A375P and A375M cells were treated with various concentrations of OMF for 12, 24, 48, and 72 h. Data are presented as means ± standard deviations of the results of five independent experiments. *Significantly different compared to control (P < 0.05). (c) untreated A375P cells (24 h); (d) 80 µg/ml OMF‐treated A375P cells for 24 h; (e) 100 µg/ml OMF‐treated A375P cells for 24 h; (f) untreated A375M cells (24 h); (g) 80 µg/ml OMF‐treated A375M cells for 24 h; and (h) 100 µg/ml OMF‐treated A375M cells for 24 h. Viability was determined by MTT assay (magnification ×20).
