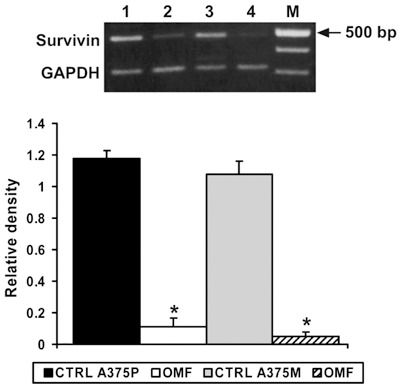
Figure 6.

RT‐PCR analysis using specific primers for survivin mRNA expression. Top: Lane 1, untreated A375P cells mRNA; lane 2, mRNA from A375P treated with 80 µg/ml 3‐O‐methylfunicone (OMF) for 24 h; lane 3, untreated A375M cells mRNA; lane 4, mRNA from A375M treated with 80 µg/ml OMF for 24 h. M, 100‐bp ladder MW marker (Roche Diagnostics). Bottom: Quantitative measurements of band intensities. Data shown are representative of five different experiments (± standard deviation). *Significantly different compared with control (P < 0.05).
