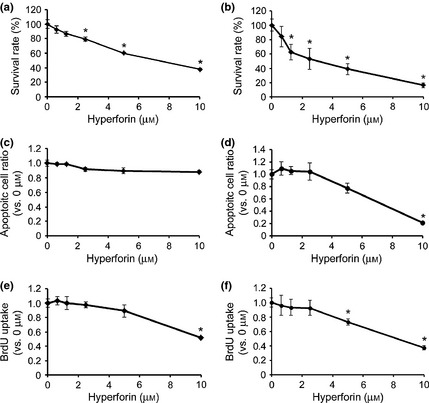
Figure 2.

Effects of hyperforin on embryonic stem ( ES ) cell apoptosis and proliferation. (a, b) Employing mouse ES (mES) cells were treated with hyperforin at indicated concentrations for 24 h (a) or 72 h (b). Cell viability was measured by CellTiter‐Glo luminescent cell viability assay. Cell cultures exposed to 0 μm drug were considered to be 100% viable. Cell viability of each drug‐treated sample was presented as percentage of that of cultures treated with 0 μm drug. (c, d) mES cells were treated with hyperforin at indicated concentrations for 24 h (c) or 72 h (d). Apoptosis was measured by cell death detection ELISA assay. Apoptotic level in each drug‐treated sample was presented as fold‐change compared to that in cultures treated with 0 μm drug. (e, f) mES cells were treated with hyperforin at indicated concentrations for 24 h (e) or 72 h (f). Uptake of BrdU was measured by ELISA. BrdU incorporation in each drug‐treated sample was presented as fold‐change compared to that in cultures treated with 0 μm drug. Data are the mean ± SEM of results from at least three independent experiments. *P < 0.05, compared to 0 μm.
