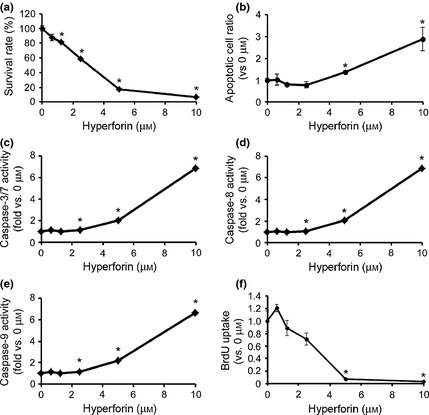
Figure 3.

Effects of hyperforin on fibroblast apoptosis. (a) NIH/3T3 cells were treated with hyperforin at indicated concentrations for 72 h. Cell viability was measured by CellTiter‐Glo luminescent cell viability assay. Cell cultures exposed to 0 μm drug were considered to be 100% viable. Cell viability of each drug‐treated sample was presented as percentage of that of cultures treated with 0 μm drug. (b) NIH/3T3 cells were treated with hyperforin at indicated concentrations for 72 h. Apoptosis was measured by cell death detection ELISA assay. Apoptotic level in each drug‐treated sample was presented as fold‐change compared to that in cultures treated with 0 μm drug. (c–d) NIH/3T3 cells were treated with hyperforin at indicated concentrations for 72 h. Caspase‐3/7 (c), ‐8 (d) and ‐9 (e) activities were determined using Caspase‐Glo Assays. Data are expressed as fold‐increases relative to respective untreated samples (RLU/60 min/μg protein). (f) NIH/3T3 cells were treated with hyperforin at indicated concentrations for 72 h. Uptake of BrdU was measured by ELISA. BrdU incorporation in each drug‐treated sample was presented as fold‐change compared to that in cultures treated with 0 μm drug. Data are expressed as mean ± SEM of results from at least four independent experiments. *P < 0.05, compared to 0 μm.
