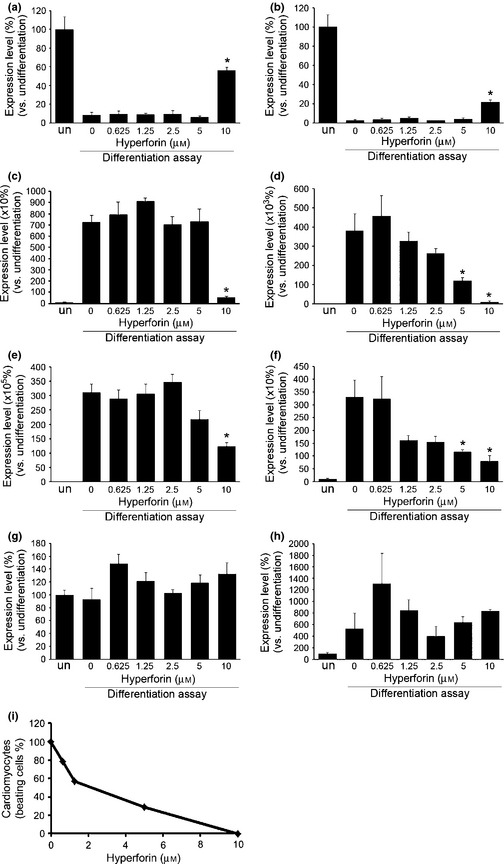
Figure 4.

Effect of hyperforin on embryonic stem ( ES ) cell differentiation. Analysis of expression levels for undifferentiated state and tissue‐specific differentiation markers. Expression levels of undifferentiated markers Oct3/4 (a) and Sox2 (b), endodermal markers GATA6 (c) and TTR (d), mesodermal markers BMP4 (e) and ANF (f) and ectodermal markers nestin (g) and GFAP (h) were quantified at each concentration of hyperforin with real‐time RT‐PCR. Each experiment was performed in triplicate. Data are expressed as mean ± SEM of results from at least three independent experiments. *P < 0.05, compared to 0 μm. un, undifferentiated ES cell. (e) The frequencies of cardiomyocytes, identified by their distinctive beating movement, derived from ES cells were quantified at each concentration of hyperforin.
