Figure l.

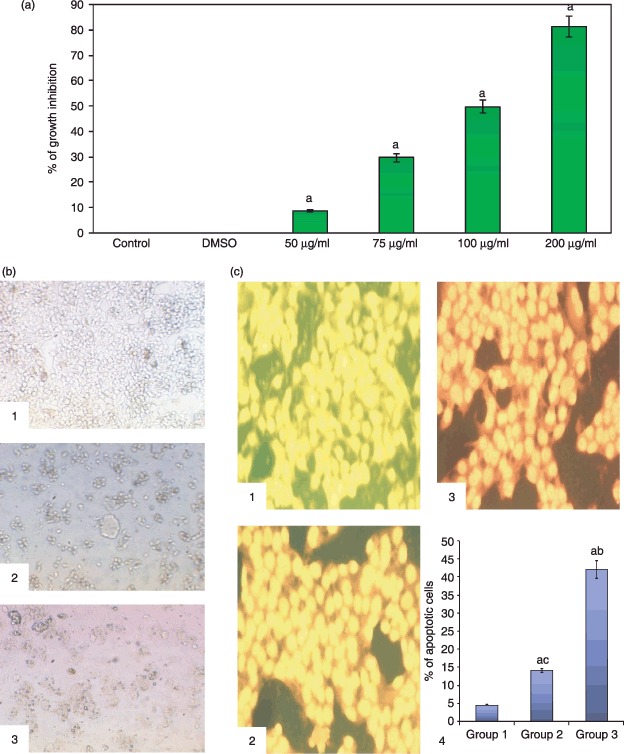
(a) MTT assay showing silymarin treatment for 24 h dose‐dependently inhibited population growth of HepG2 cells. (b) Morphological changes of HepG2 by light microscopy (×20): (1) HepG2 controls, (2) treatment with 50 mg/ml of silymarin and (3) treatment with 75 µg/ml of silymarin. (c) Silymarin increased percentage of apoptosis of HepG2 cells as viewed by fluorescence microscopy (ethidium bromide/acridine orange staining, ×25): (1) HepG2 control (showing viable green fluorescent nuclei), (2) treatment with 50 µg/ml of silymarin (early apoptotic cells are yellow fluorescent nuclei), (3) treatment with 75 µg/ml of silymarin (late apoptotic cells with orange fluorescent nuclei), and (4) representative bar chart showing percentage of apoptotic cells. Results are expressed as mean ± standard deviation (n= 3). P < 0.05 compared with aHepG2 control, b50 µg/ml of silymarin and c75 µg/ml of silymarin.
