Figure 2.

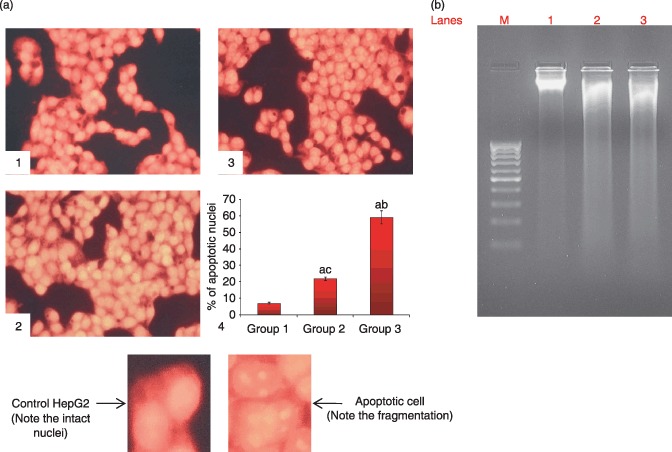
(a) Silymarin increased percentage of apoptosis in HepG2 cells as viewed by fluorescence microscopy (propidium iodide staining, ×25). (1) HepG2 control (normal nuclear pattern), (2) treatment with 50 µg/ml silymarin (nuclear condensation and fragmentation), (3) treatment with 75 µg/ml silymarin (nuclear condensation and fragmentation) and (4) representative bar chart showing percentage of apoptotic nuclei. Results are expressed as mean ± standard deviation (n= 3). P < 0.05 compared with aHepG2 control, b50 µg/ml of silymarin and c75 µg/ml of silymarin. (b) Silymarin‐induced apoptosis in HepG2 cells as revealed by agarose gel electrophoresis pattern of nuclear DNA. Lanes 1, 2, 3 and M representing HepG2 control, 50 µg/ml silymarin, 75 µg/ml silymarin and marker, respectively.
