Figure 4.

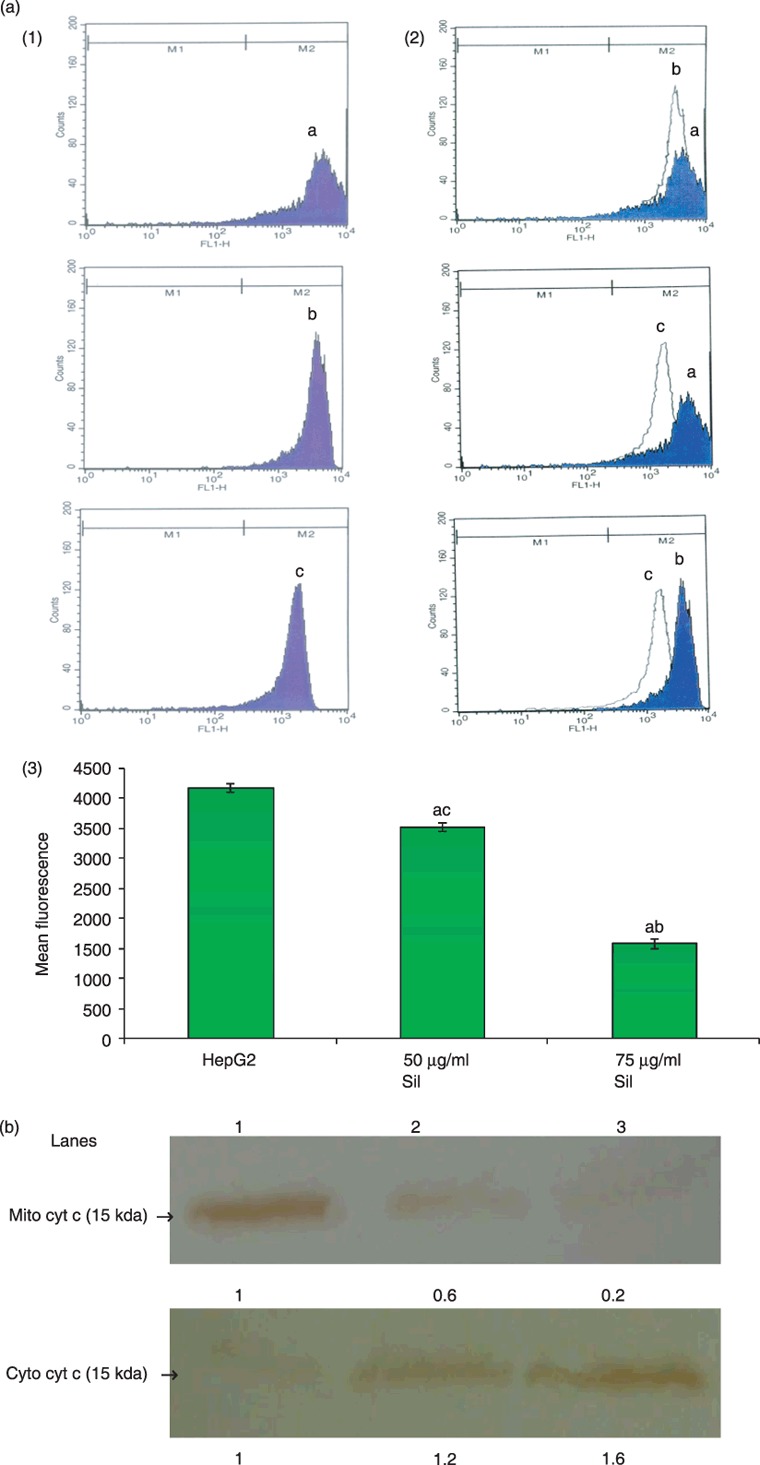
(a) Silymarin treatment decreased mitochondrial transmembrane potential of HepG2 cells. (1) Mitochondrial membrane potential as assessed by staining with rhodamine 123. (a), (b) and (c) representing control HepG2 cells, treatment with 50 µg/ml of silymarin, and treatment with 75 µg/ml silymarin, respectively. (2) Overlay. (3) Bar chart representing mean fluorescence of rhodamine 123 in HepG2 control, treatment with 50 µg/ml silymarin, and treatment with 75 µg/ml silymarin. (b) Silymarin treatment released cytochrome c from mitochondria into the cytosol in HepG2 cells. Lanes l, 2 and 3 correspond to the lysates of HepG2 control, 50 µg/ml silymarin and 75 µg/ml silymarin, respectively. P < 0.05 compared with aHepG2 control, b50 µg/ml of silymarin and c75 µg/ml of silymarin.
