Figure 5.

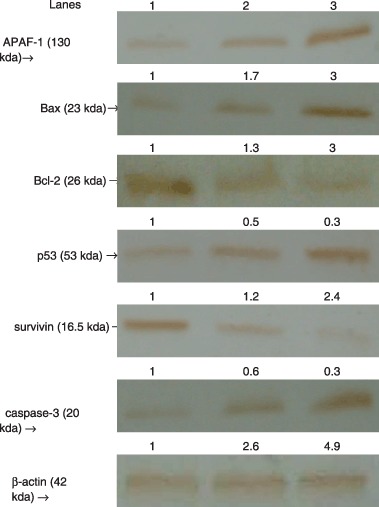
Immunoblotting analysis of APAF‐1, Bcl‐2, Bax, p53, survivin and caspase‐3 in control and silymarin‐treated HepG2 cells. Lanes l, 2 and 3 correspond to the lysates of HepG2 control, 50 µg/ml silymarin and 75 µg/ml silymarin, respectively.

Immunoblotting analysis of APAF‐1, Bcl‐2, Bax, p53, survivin and caspase‐3 in control and silymarin‐treated HepG2 cells. Lanes l, 2 and 3 correspond to the lysates of HepG2 control, 50 µg/ml silymarin and 75 µg/ml silymarin, respectively.