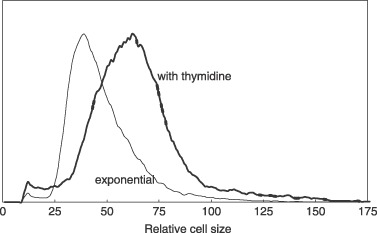
Figure 2.

Size distribution of thymidine‐inhibited cells compared to exponential control cells. L1210 cells were treated with thymidine for 19 h. The cell size distribution of inhibited cells was compared to untreated control cells. Inhibited cells had a size distribution clearly larger than the exponential cells, and size distribution was as wide as that of exponential cells. There is no narrowing of size distribution as would be expected for truly synchronized cells.
