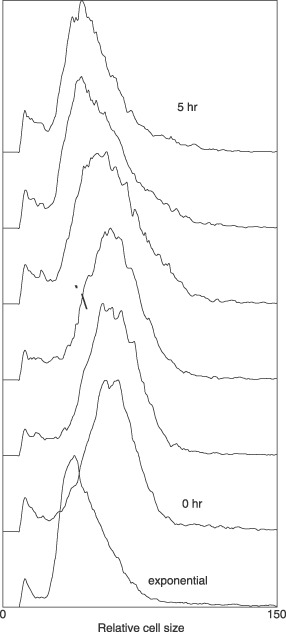
Figure 4.

Size distributions of cells on release from thymidine inhibition. Bottom line, size distribution of exponential cells and line immediately above, thymidine‐inhibited cells. Note that as in Fig. 2 cell sizes of inhibited cells are larger and not narrowed as expected. When the thymidine‐inhibited cells were now allowed to grow without thymidine the pattern did not indicate synchronized divisions.
