
Figure 6.
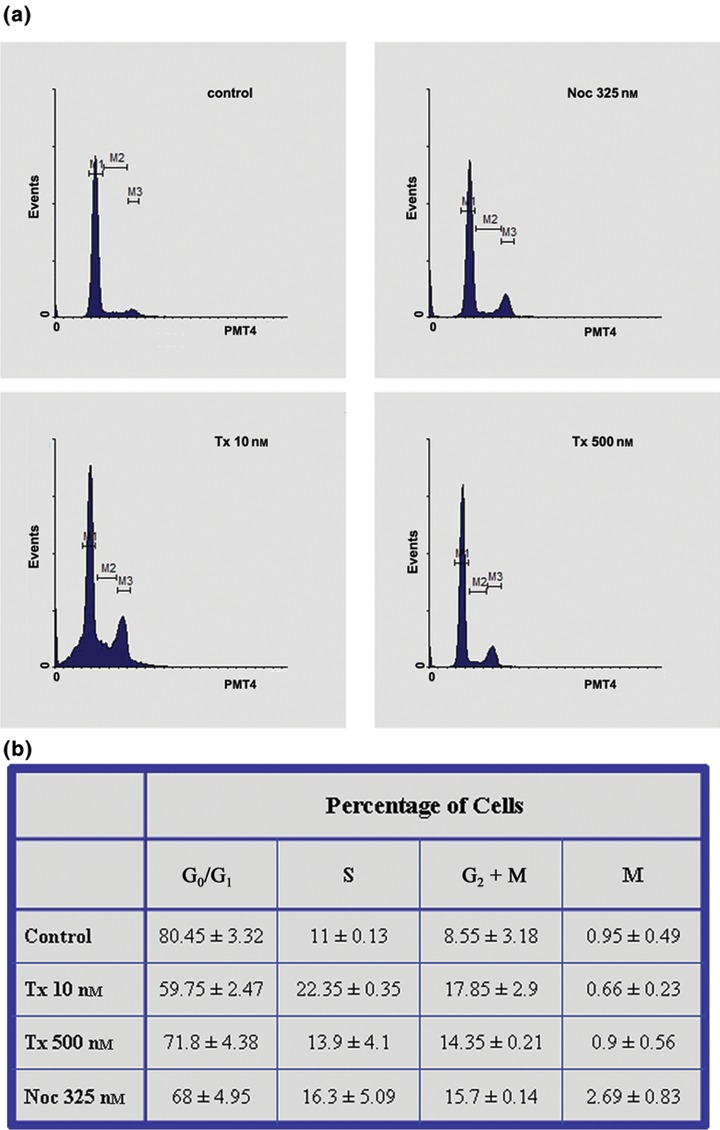
Effect of taxol and nocodazole on cell cycles. (a) Cell cycle analysis of untreated and treated hMSCs with taxol and nocodazole for 3 days. (b) Percentage of viable cells in the different phases of the cell cycle in untreated (control) and treated hMSCs with taxol and nocodazole for 3 days. Percentage of cells in M phase was determined by counting interphase and mitotic cells grown on coverslips and stained with DAPI. Values are means ± standard error of measurements in three separate experiments.