
Figure 3.
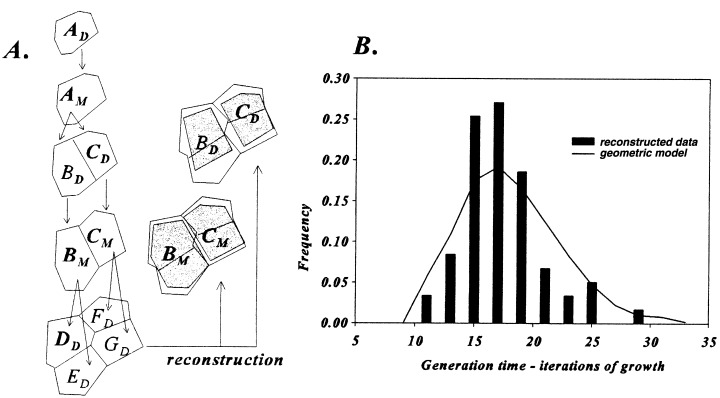
Generation time from Q cells in Figure 1B. (A) Reconstruction (shaded areas) of cells (B) and (C) at their inception and later at time of division. See text for method of calculations. B. Probability distribution of cell cycle duration.
Official websites use .gov
A
.gov website belongs to an official
government organization in the United States.
Secure .gov websites use HTTPS
A lock (
) or https:// means you've safely
connected to the .gov website. Share sensitive
information only on official, secure websites.
Generation time from Q cells in Figure 1B. (A) Reconstruction (shaded areas) of cells (B) and (C) at their inception and later at time of division. See text for method of calculations. B. Probability distribution of cell cycle duration.