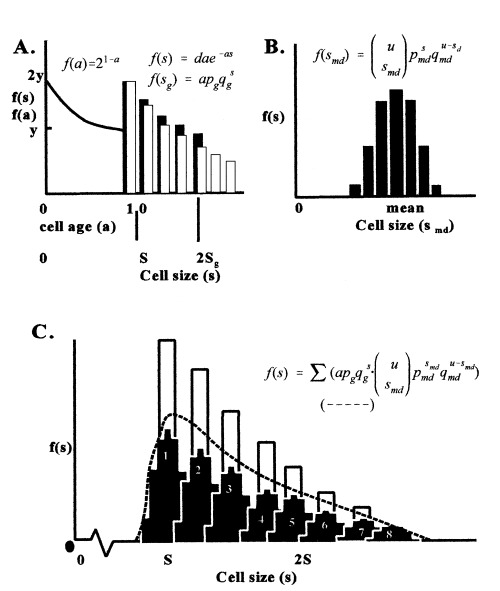
Figure 5.

Graphs of steps in developing the equation for cell size. Equations are explained in text. (A) Mitchison’s model for cell age (line), Korn’s model for cell size (dark bars), and new discrete geometric model of growth/age (white bars). Equations are for both a continuous (f(sg) = dae−as) and discrete (f(sg) = ap qg s − (1)). (B) Model for new cells as a compound binomial distribution (black bars). (C) Joint distribution of growth (white bars), daughter cell cohort at different times (sets of black bars) and the cumulation of cells from different age cohorts of the same size (dashed line) corresponding to what is observed in actual tissue.
