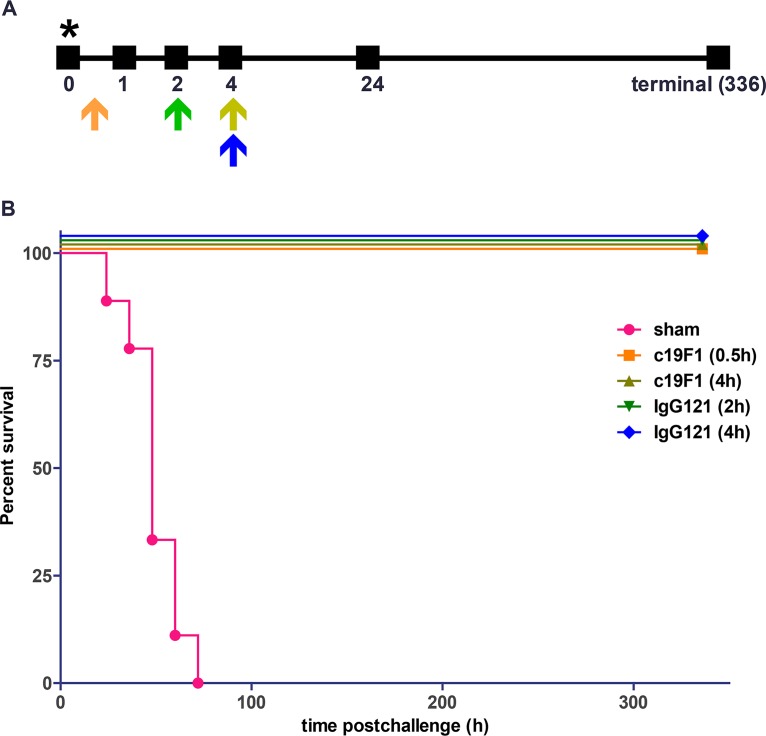
FIG 3.
(A) Diagram of antibody treatment schedule, representing single dosage time point/group, and sampling time after SEB challenge in macaques. Orange arrow, c19F1 0.5-h treatment; olive arrow, c19F1 4-h treatment; green arrow, IgG121 2-h treatment; blue arrow, IgG121 4-h treatment. The asterisk represents the hour of SEB challenge. (B) Kaplan-Meier survival curve for the sham group (n = 9) and groups treated with c19F1 at 0.5 h (n = 8), c19F1 at 4 h (n = 4), IgG121 at 2 h (n = 4), and IgG121 at 4 h (n = 4).

