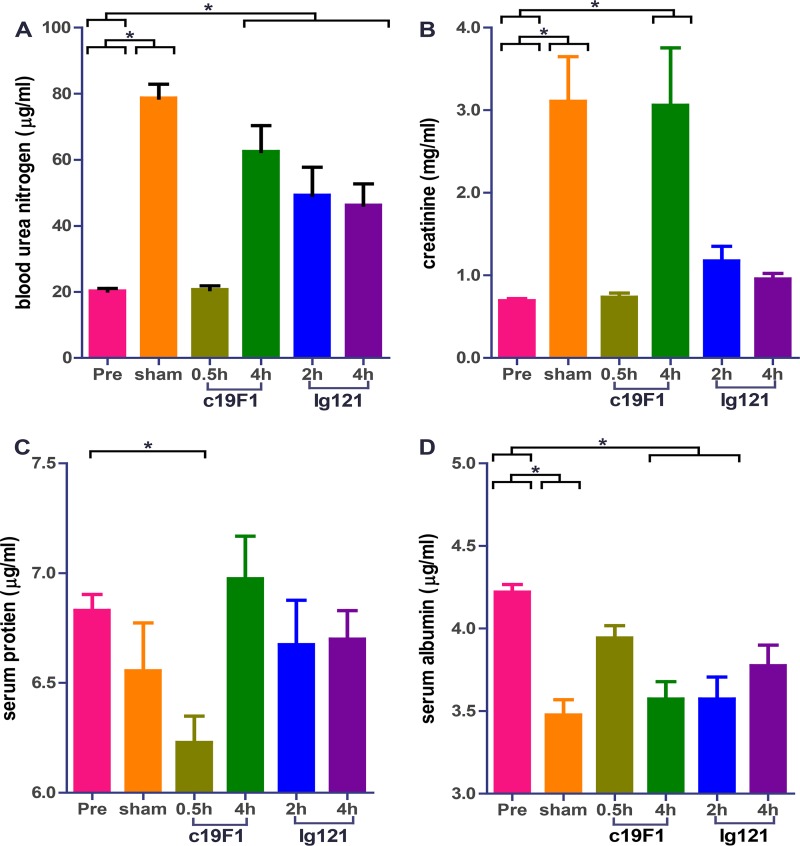
FIG 6.
Relevant clinical chemistries derived from peripheral blood from all animals (n = 23) prior to SEB challenge and 24 h postchallenge and/or treatment with either antibody. Each graph shows blood urea nitrogen (A), creatinine (B), serum protein (C), or serum albumin (D). Significant differences (P < 0.05) for either sham control or treated animals from preexposure values is indicated with an asterisk.

