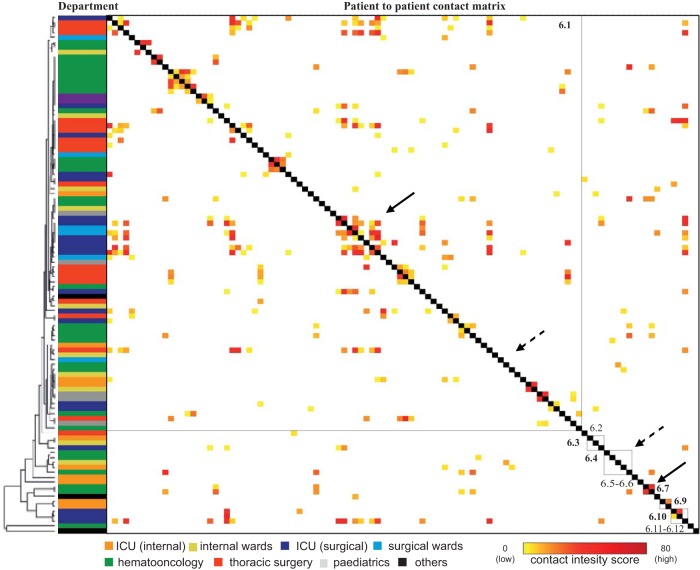
FIG 3.
Phylogeny of NGS cluster 6 in combination with the epidemiological links of the corresponding patients. The phylogenetic tree is based on the specific NGS cluster core genome. Epidemiological links of all patients were calculated based on room occupancy data, and the contact intensity score was color-coded for each patient pair in the matrix. The contact intensity score of each patient with another is shown on the x and y axes in the same order (patient 1 patient to 106). While closely related isolates with strong epidemiological links (clustering of high-contact intensity scores around the gray middle line) suggested intrahospital transmission (cluster 6.1 and 6.7, marked with solid arrows), for several patients an epidemiological link could not be established (e.g., 6.1, lower part; 6.4, marked with dashed arrows).

