FIG 4.
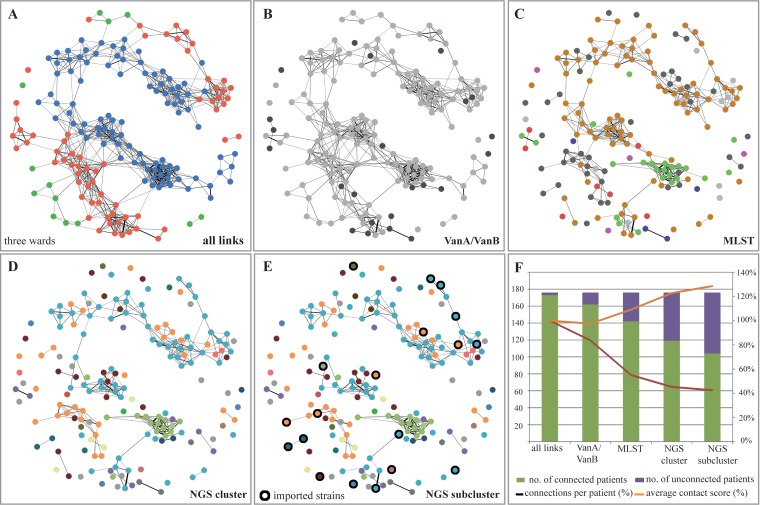
Overview of epidemiological links and possible transmission routes depending on the depth of typing. The epidemiological links between all VRE patients of one department comprising three wards were scored, and the network of patient contacts is displayed. The connection line thickness represents the contact intensity score between two patients. (A) All links between the patients of the three wards are shown. (B and C) The patient contact network is displayed integrating the information of the type of van gene, whereas the MLST information was integrated into the contact network. (D and E) Integration of NGS cluster information and subcluster information further reduced the number of epidemiological links and possible transmissions. In addition, strains imported into the hospital are marked with a black ring in panel E. (F) Summary of patient contacts and the strength of the epidemiological link. More detailed resolution of the typing method limited the potential epidemiological transmissions and led to more patients for whom no epidemiological link could be established. At the same time, epidemiological contact intensity scores increased, thus making transmission more likely.

