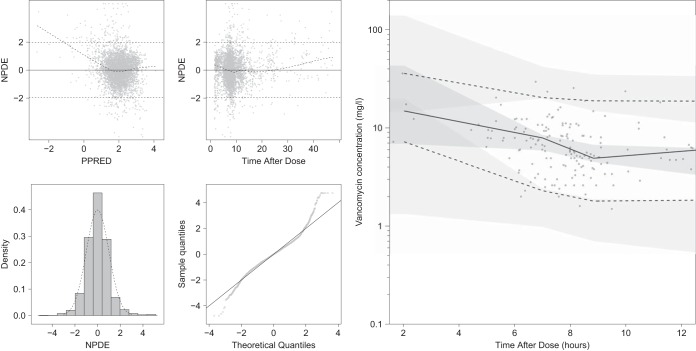
FIG 1.
(Left) Simulation-based goodness-of-fit plots on the training data, including normalized prediction distributed error (NPDE) versus population predictions (PPRED: on natural logarithm scale), NPDE versus time after dose, density distribution of NPDE, and a qq-plot for NPDE. (Right) visual predictive check of 2,000 simulated concentration-time profiles using the final model for the test data. Points represent the observations, black lines represent the 2.5th, 50th, and 97.5th percentiles, and the shaded areas represent the 95% confidence intervals of the corresponding predicted vancomycin concentration percentiles. The x axis of the visual predictive check was constrained between 1.5 and 12 h, leaving 14 scattered samples between 12 and 48 h not shown.

