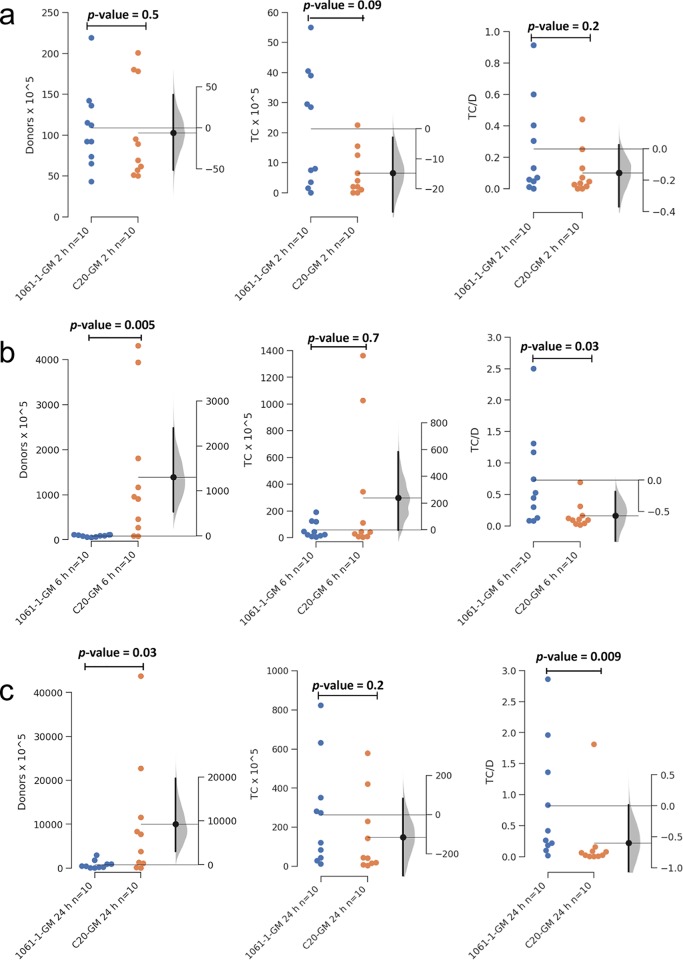
FIG 2.
Gardner-Altman 2-group mean-difference plot showing the difference between donors (D) transconjugants (TC) and transconjugant/donor (TC/D) ratios at (a) 2 h, (b) 6 h, and (c) 24 h for the poultry meat strain 1061-1-GM (blue) and the human strain C20-GM (orange) in CoMiniGut cultures. The left axis shows the number of donors detected by FACS. On the right axis, the filled curve indicates the complete Δ distribution given the observed data. The human strain C20-GM survives better than the poultry strain 1061-1-GM; however, more transconjugants were detected from the poultry meat strain than the human UTI strain. The low and high bias-corrected and accelerated bootstrap interval values are shown as a density plot on the right side. The confidence interval of the mean differences at 95% is illustrated by the thick black line. Significance was determined by the Mann-Whitney U test.

