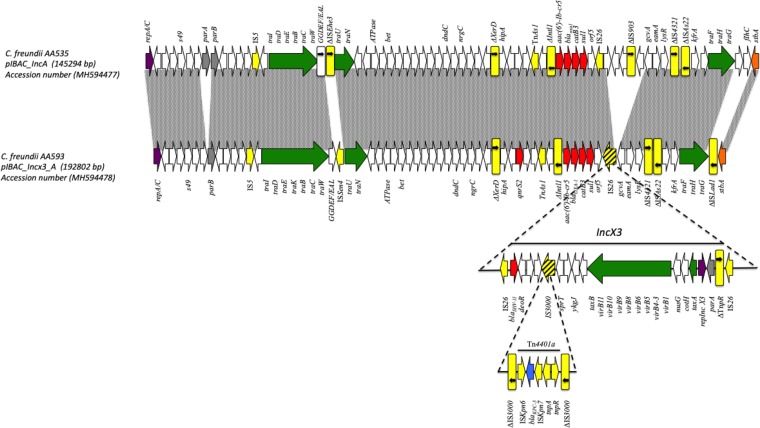
FIG 2.
Linear map of pIBAC_IncA and pIBAC_IncX3_A. Arrows, direction of transcription of open reading frames (ORFs); rectangles, truncated ORFs. Replicons, partitioning genes, mobile elements, conjugal transfer genes, antibiotic resistance, blaKPC-3, and other remaining genes are designated by violet, gray, yellow, green, red, blue, and white, respectively. Gray shaded area in upper part shows similarity of both IncA plasmids. Lower part shows the IncX3 plasmid region of pIBAC_IncX3_A and its insertion/fusion point, which is shown as striped yellow arrows/rectangles in the IncX3 region.

