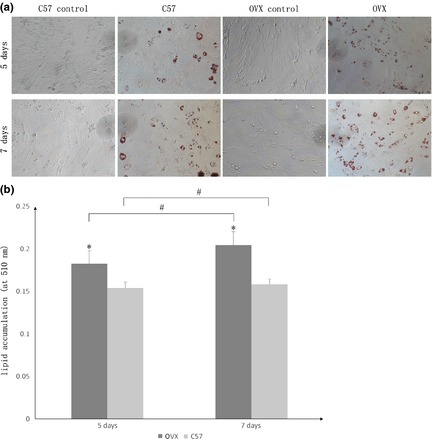
Figure 2.

Oil red O staining and spectrophotometer quantification results after adipogenic induction of adipose tissue‐derived stem cells ( ADSC s) in each group (×200). (a) Cells were divided into four groups: (i) Those obtained from ovariectomized (OVX) group with induction (OVX); (ii) Cells obtained from OVX group without induction (OVX control); (iii) Cells obtained from control group with induction (C57); (iv) Cells obtained from control group without induction (C57 control). After 5 and 7 days in differentiation medium, oil red‐O staining was carried out to investigate adipogenic differentiation of all the four groups of ADSCs. (b) Oil red‐O spectrophotometer quantification was performed for OVX and C57 groups. The data demonstrate that lipid accumulation of the OVX group was significantly higher than that of the C57 group, at each time point, as indicated by *. Adipogenic induction also promoted adipogenesis time dependently as indicated by #. Both # and * represent P < 0.05.
