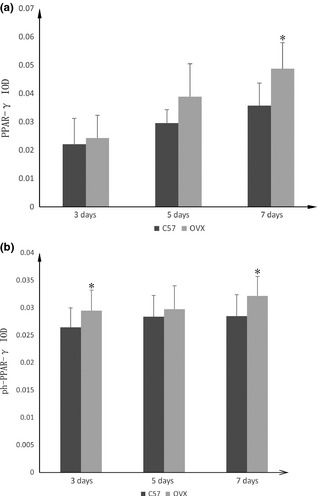
Figure 6.

Integral optical density ( IOD ) was measured to evaluate PPAR ‐γ and ph‐ PPAR ‐γ concentration. (a) PPAR‐γ expression was higher in ovariectomized (OVX) groups than in controls at each time point and the difference was significant on day 7. (b) IOD of ph‐PPAR‐γ also higher in OVX groups than in controls at each time point, and the difference was significant on day 3 and 7. P < 0.05 were considered statistically significant, as indicated by *.
