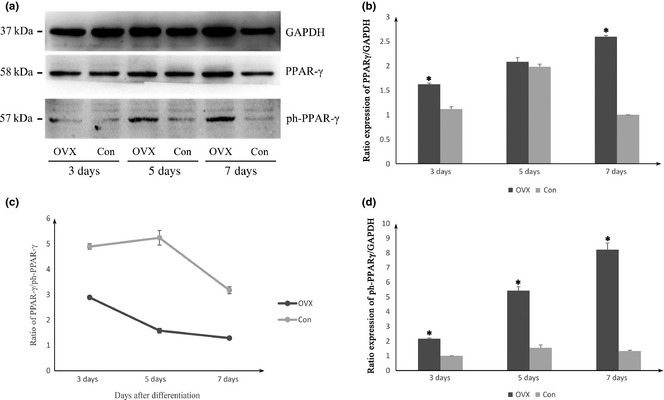
Figure 7.

Protein expression levels of PPAR γ and ph‐ PPAR γ in ovariectomized ( OVX ) and control group. (a) Representative Western blot analysis of PPARγ and ph‐PPARγ proteins separated by SDS‐PAGE. Histograms represent relative PPARγ level (b) and ph‐PPARγ level (c) as detected by Western blot and densitometric analysis, *P < 0.05 compared with respective value of control group. (d) The ratio of PPARγ/ph‐PPARγ expression was also determined in both groups. All data were normalized by GAPDH, expressed as optical density and represent the mean ± SD of three different samples.
