
Figure 1.
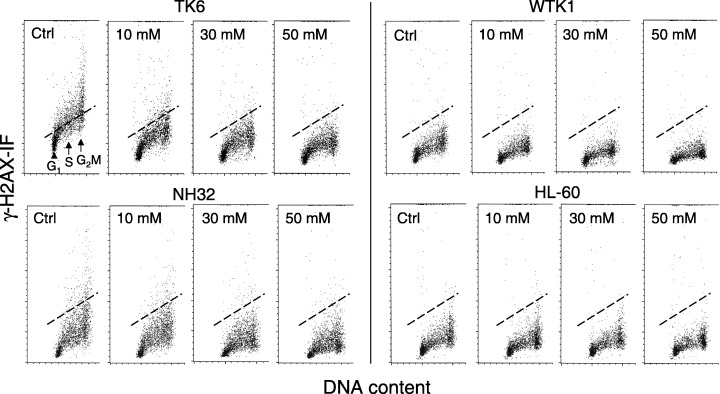
Bivariate cellular DNA content vs. γH2AX IF distributions (scatterplots) of TK6, WTK1, NH32 and HL‐60 cells, untreated (ctrl) and treated with NAC at a concentration of 10–50 mm for 2 h. The intensity of γH2AX IF of cells in all four lines was measured under identical settings of photomultiplier sensitivity. The dashed‐line provides the position marker that represents the mean value of γH2AX IF of S‐phase TK6 cells from the untreated culture. The line is positioned at the same level in other panels, for comparison with γH2AX IF of NAC‐treated cells and between the other cell lines studied.