
Figure 3.
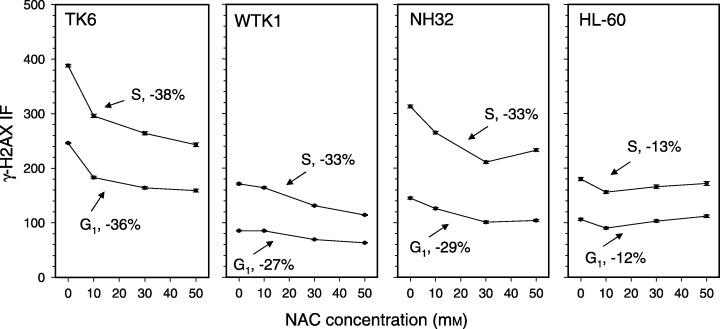
Changes in mean γH2AX IF of G1 and S cells as a function of cell treatment with different concentration of NAC. The cells were untreated or were treated with 10, 30 or 50 mm NAC for 2 h, then fixed, and by gating analysis their mean γH2AX IF and the DNA content were estimated for subpopulations of cells in G1 and S phases of the cell cycle. The percent of maximal decrease of the mean γH2AX IF of the NAC‐treated G1 or S‐phase cells, with respect to the untreated cells in S or G1 phase, respectively, is shown for each cell line. As in Fig. 2, the ticks representing SEM for each measurement can barely be seen.