Figure 1.

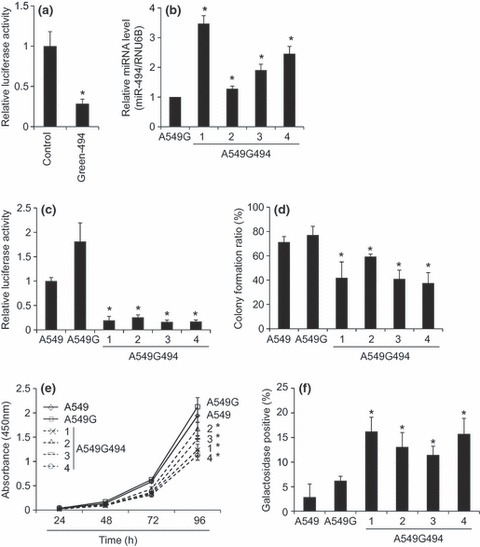
Functional characterization of A549 cells stably expressing miR‐494. (a) Verification of miR‐494 function expressed from the miR‐494 expression vector in A549 cells. Green‐494, an miR‐494 expression vector, or control pmR‐Zs‐Green1, was co‐transfected with pGL3‐Promoter‐494, which possesses the miR‐494 target sequence in the 3’‐UTR of the luciferase gene. After 48 h transfection, relative luciferase activities between control and Green‐494 were normalized by luciferase activities obtained from the pGL3‐Promoter set to 1. This means that luciferase activities obtained from pGL3‐Promoter‐494 reporter was divided by those obtained from pGL3‐Promoter. Bar indicates mean and standard deviation. Student’s t‐test: *P < 0.05 (n = 3). (b) Quantitative determination of miR‐494 expression level by Taqman real‐time RT‐PCR. Bar indicates mean and standard deviation. Student’s t‐test: *P < 0.05 (n = 3). (c) Establishment of miR‐494 stably expressing clones. A549G494 clones 1 to 4 were established by transfecting Green‐494 into A549 cells, and then selected by their resistance to G418 and GFP expression. Similarly, A549G was established by transfecting control pmR‐Zs‐Green1. These clones and parental A549 cells were subjected to luciferase assay using pGL3‐Promoter‐494. After 72 h transfection, relative luciferase activities were normalized by luciferase activities obtained from the pGL3‐Promoter set to 1. Bar indicates mean and standard deviation. Student’s t‐test: *P < 0.05 (n = 3, versus A549 and A549G respectively). (d) Colony formation ability of clones stably expressing miR‐494. A549G494 clones 1 to 4, control A549G and parental A549 cells were inoculated into 96‐well plates (1 cell per well), and after 7 days colony formation, the ratio was determined. Bar indicates mean and standard deviation. Student’s t‐test: *P < 0.05 (n = 3, versus A549 and A549G, respectively). (e) Cell proliferation rate of clones stably expressing miR‐494. A549G494 clones 1 to 4, control A549G and parental A549 cells were inoculated into 24‐well plates (500 cells per well), and then WST‐1 assay was performed at indicated time points. Bar indicates mean and standard deviation. Student’s t‐test: *P < 0.05 (n = 3, versus A549 and A549G, respectively). (f) Cell senescence of clones stably expressing miR‐494. β‐galactosidase activities of A549G494 clones 1 to 4, control A549G and parental A549 cells were detected with X‐gal staining. Bar indicates mean and standard deviation of blue stained cells. Student’s t‐test: *P < 0.05 (n = 3, versus A549 and A549G respectively).
