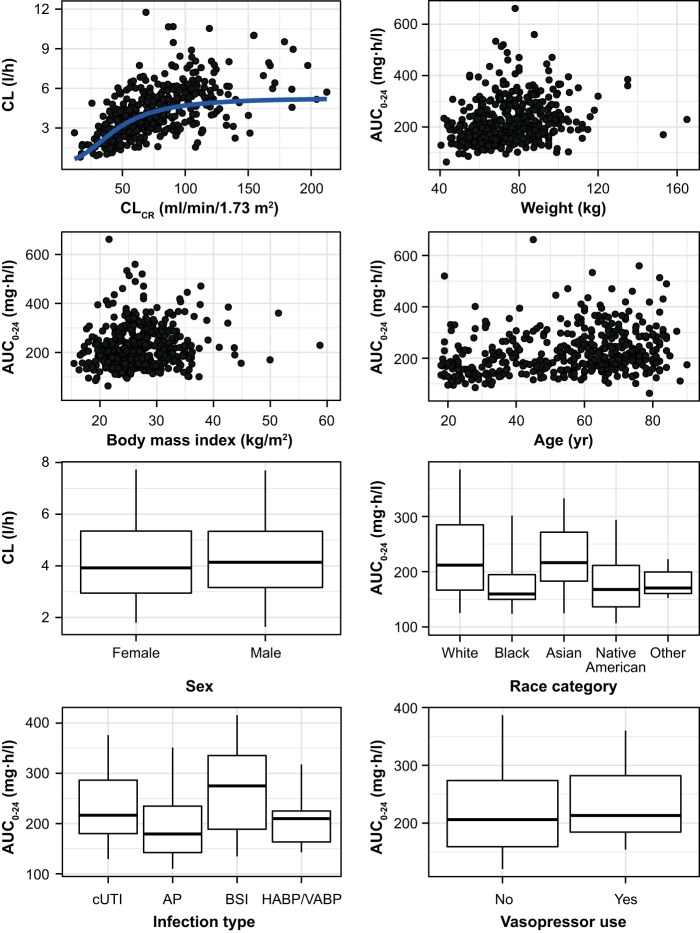
FIG 2.
Relationships between post hoc plazomicin parameter estimates (AUC or CL) following initial dosing and covariate category (CLCR, BW, BMI, age, sex, race, infection type, or vasopressor use) for patients in the phase 2 and 3 studies. The horizontal lines in box-whiskers plots are the median; the boxes show the 25th to 75th percentiles, and whiskers extend to the 5th and 95th percentiles.

