
Figure 2.
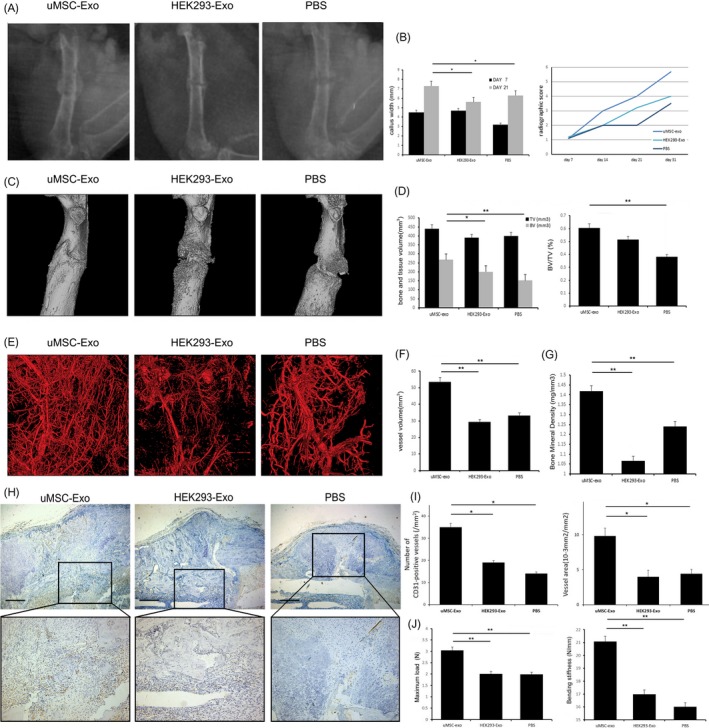
Radiographic and histological analysis of the fracture healing. A, Representative X‐ray images of the fractures on post‐operative day 14. B, Quantitative analysis of the CW on post‐operative days 7 and 21 (left panel). Bone formation in X‐ray images was assessed on post‐operative days 7, 14, 21 and 31 (right panel), using a radiographic score as described in Section 2. n = 6. C, Representative Micro‐CT images of the fractured femur on post‐operative day 14. D, TV and BV of the callus, and BV/TV on post‐operative day 14 was quantified. n = 6. E, BMD on post‐operative day 14 was quantified using Micro‐CT. n = 6. F, Representative Micro‐CT images of the vascular system on post‐operative day 14. G, On day 14 after surgery, vessel volume was quantified on Micro‐CT images. n = 6. H, The fractured callus on post‐operative day 14 stained with anti‐CD31. Representatives were shown, and boxed areas were enlarged on the bottom. Scale bar for original images = 200 mm. I, The number of CD31‐positive vessels (left panel) was counted, and the ratio of vessel area (right panel) was measured n = 6. (*P < 0.05, **P < 0.01, CT, computed tomography; BMD, bone mineral density; BV, bone volume; TV, total volume