
Figure 3.
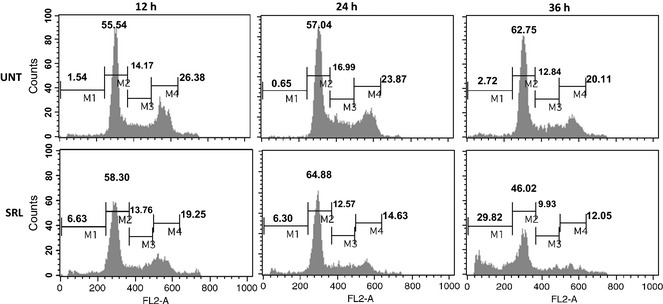
Effect of SRL on different phases of the cell cycle. Human ovarian cancer PA‐1 cells incubated with or without SRL (25 μg/ml) for 12, 24 and 36 h. Cells were stained with PI and data were acquired on FL2‐A channel of flow cytometer equipped with 488 nm laser. X‐axis represents DNA content of cells and the Y‐axis represents cell number. M1, M2, M3 and M4 represent cell population in hypodiploid/apoptotic, G0/G1, S and G2/M phases respectively.