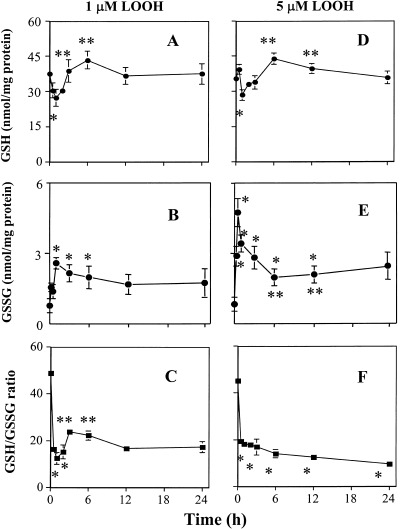
Figure 8.

Kinetics of LOOH‐induced changes in cellular GSH, GSSG and GSH‐to‐GSSG ratio in CaCo2 cells. CaCo‐2 cells grown in serum‐free DMEM were treated with 1 or 5 µM LOOH for 0–24 h. At designated times, cells were harvested and processed for HPLC analysis of cellular GSH/GSSG status. Panels (a), (b) and (c) represent GSH, GSSG and GSH‐to‐GSSG ratio in cells treated with 1 µM LOOH, respectively. Panels (d), (e) and (f) represent GSH, GSSG and GSH‐to‐GSSG ratio in cells treated with 5 µM LOOH, respectively. Each value is the mean ± SE of four separate experiments. * P < 0.05 versus 0 min control; ** P < 0.05 versus 30 min.
