
Figure 1.
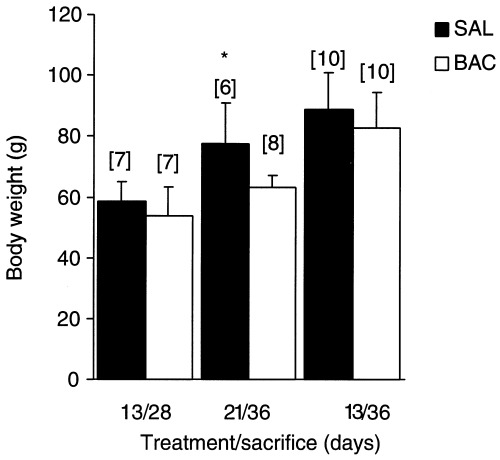
Effect of BAC‐treatment on body weight (g). *P < 0.05 compared to control, using Student's t‐test for paired observations); n = number of animals.
Official websites use .gov
A
.gov website belongs to an official
government organization in the United States.
Secure .gov websites use HTTPS
A lock (
) or https:// means you've safely
connected to the .gov website. Share sensitive
information only on official, secure websites.
Effect of BAC‐treatment on body weight (g). *P < 0.05 compared to control, using Student's t‐test for paired observations); n = number of animals.