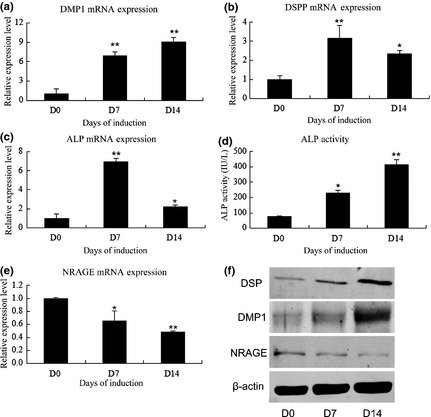
Figure 1.

Expression of NRAGE during odontoblastic differentiation of mDPCs. mRNA expression of mineralization‐related markers and NRAGE on days 0, 7 and 14 after induction: (a) DMP1, (b) DSPP, (c) ALP, (d) ALP activity and (e) NRAGE. Glyceraldehyde‐3‐phosphate (GAPDH) was used as normalization control. (f) DSP, DMP1 and NRAGE protein levels on days 0, 7 and 14 after induction. *Significant difference (P < 0.05) versus day 0, **Significant difference (P < 0.01) versus day 0.
