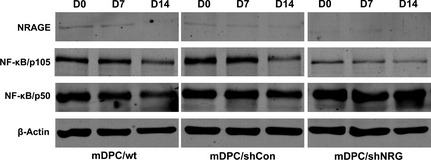
Figure 6.

Protein levels of NRAGE and NF‐κB after odontoblastic induction for 0, 7 and 14 days in mDPC/wt, mDPC/shCon and mDPC/shNRG groups. NRAGE was stably knocked down during induction in the mDPC/shNRG group. Protein levels of NF‐κB/p50 and NF‐κB/p105 by western blot analysis.
