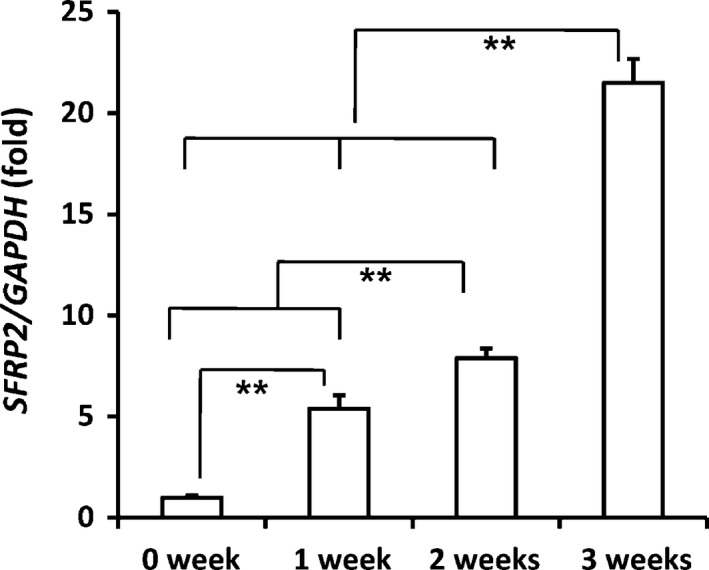
Figure 1.

SFRP 2 expression increased in differentiated SCAP s. Real‐time RT‐PCR analysis of SFRP2 mRNA levels in differentiated SCAPs. GAPDH was used as an internal control. One‐way ANOVA was used to calculate statistical significance. Error bars represent the SD (n = 3). **P ≤ 0.01.
