Figure 4.

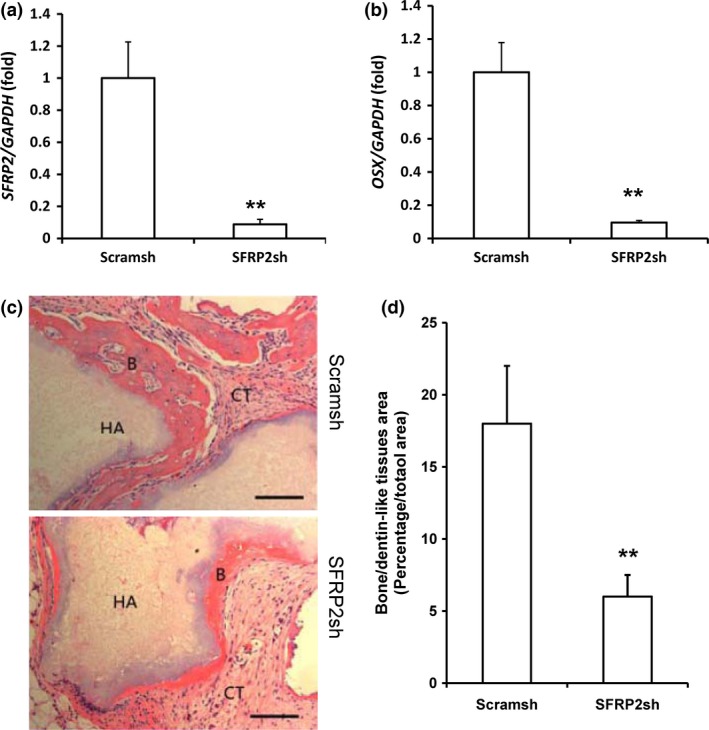
SFRP 2 knock‐down inhibited osteo‐/dentinogenic potential in SCAP s. (a) Real‐time RT‐PCR analysis of SFRP2 expression after SFRP2 depletion in SCAPs. (b) Real‐time RT‐PCR analysis of OSX expression in SFRP2‐depleted SCAPs. GAPDH was used as an internal control. Error bars represent the SD (n = 3). (c) H&E‐stained micrographs of bone/dentin‐like tissue formation derived from SFRP2‐shRNA cells transplanted into nude mice for 8 weeks. (d) Qualitative measurement of bone/dentin‐like tissues in transplant tissue samples. Student's t‐test was used to determine statistical significance. Error bars represent the SD (n = 5). **P ≤ 0.01. Bar: 100 μm. B, bone/dentin‐like tissues; HA, hydroxyapatite tricalcium carrier; CT, connective tissue.
