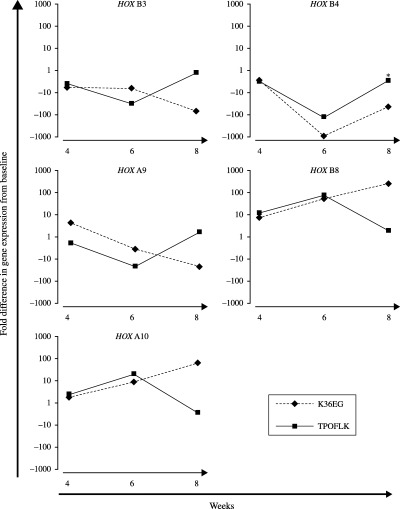
Figure 4.

Quantitative RT‐PCR analysis of HOX gene expression in TPOFLK‐ and K36EG‐stimulated cord blood CD133+ cells. The effect of TPOFLK and K36EG stimulations on the expression of several HOX genes in expanding CD133+ cell was analysed by quantitative RT‐PCR by measuring the relative fold difference with day 0 HOX gene expression. At week 8 TPOFLK induced more expression of HOX B3, HOX B4 and HOX A9 genes known to be preferentially expressed in primitive HSPC than K36EG, which favoured expression of HOX B8 and HOX A10 associated with commitment to the myeloid lineage.
