
Figure 2.
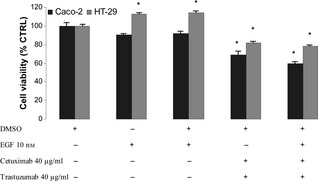
Effect of EGF , cetuximab and trastuzumab on population growth of HT ‐29 and Caco‐2 cells after 48 h treatment. Results expressed as percentage of control with 100% representing control cells treated with DMSO alone. Vertical bars ± SE of triplicate assays. *P < 0.05 versus control values of cells treated with DMSO alone (one‐way ANOVA followed by Student's t‐test).