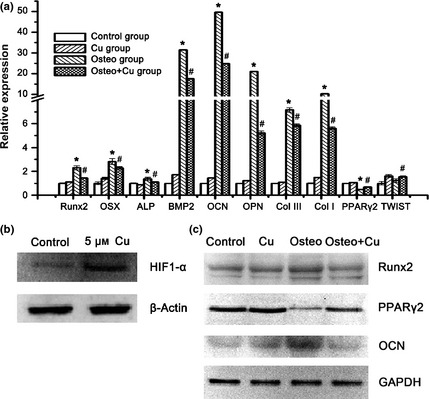
Figure 4.

Analysis of osteogenic differentiation‐related genes. (a) Expression of Runx2, Osx, Alp, Bmp2, Ocn, Opn, Col III, Col I, Pparγ2 and TWIST genes as detected by Q‐PCR after 7 days of culture. Each experiment consisted of triplicate samples for a treatment. Values are presented as mean ± SEM. *Significantly different from the Control group (P < 0.05). #Significantly different from the Osteo group (P < 0.05). (b) Protein expression of HIF1‐α and β‐actin as detected by Western blotting. (c) Expression of Gapdh, Runx2, Pparγ2 and Ocn proteins as detected by Western blotting.
