
Figure 1.
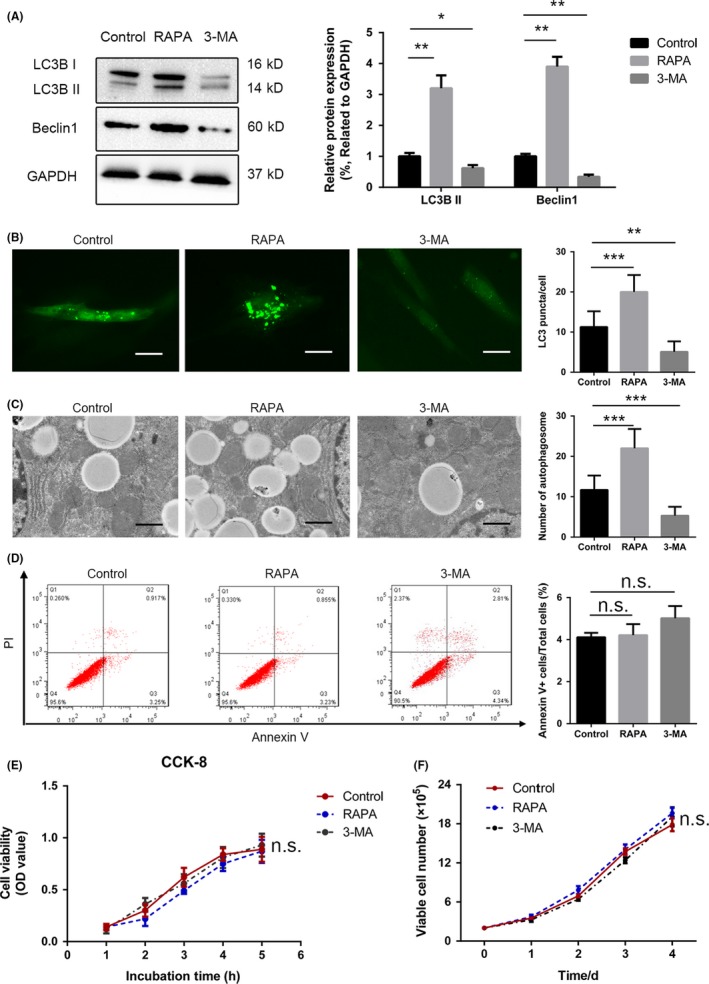
Regulation of autophagy in UC‐MSCs. A, UC‐MSCs were exposed to rapamycin or 3‐MA for 24 h and autophagy levels were determined by analysing LC3B II/I ratio and Beclin1/GAPDH with anti‐LC3B antibody and anti‐Beclin1 antibody. GAPDH housekeeping protein was used as control. Semi‐quantitative analysis of Western blot about Beclin1 protein expression and the change of LC3B II/I ratio. B, After 24 h of transfection with a lentiviral vector containing GFP‐LC3B, UC‐MSCs were subjected to various treatment conditions. Subsequently, puncta‐like staining was detected under on fluorescence microscopy (×200). Green puncta were counted from five cells in each group. C, Transmission electron microscopy was used to observe autophagosomes in UC‐MSCs in the different treatment groups. The number of autophagosomes was counted in representative images from three independent experiments. D, Apoptosis of UC‐MSCs was measured by Annexin V/propidium iodide staining after exposure to the different treatments. The results of the statistical analysis for the percentage of Annexin V‐positive neutrophils are shown. Data are presented as the mean ± standard error of the mean (n = 5) for each group. E, UC‐MSCs were subjected to a CCK‐8 assay after treatment with rapamycin or 3‐MA for 1, 2, 3, 4 and 5 h to assess cell viability. F, UC‐MSCs were counted after exposure to rapamycin or 3‐MA for 0, 1, 2, 3 and 4 d. Data for control and treated groups are presented as the mean ± standard error of the mean. *P < 0.05, **P < 0.01, ***P < 0.001 (all one‐way analysis of variance). 3‐MA, 3‐methyladenine; UC‐MSCs, umbilical cord‐derived mesenchymal stem cells